
















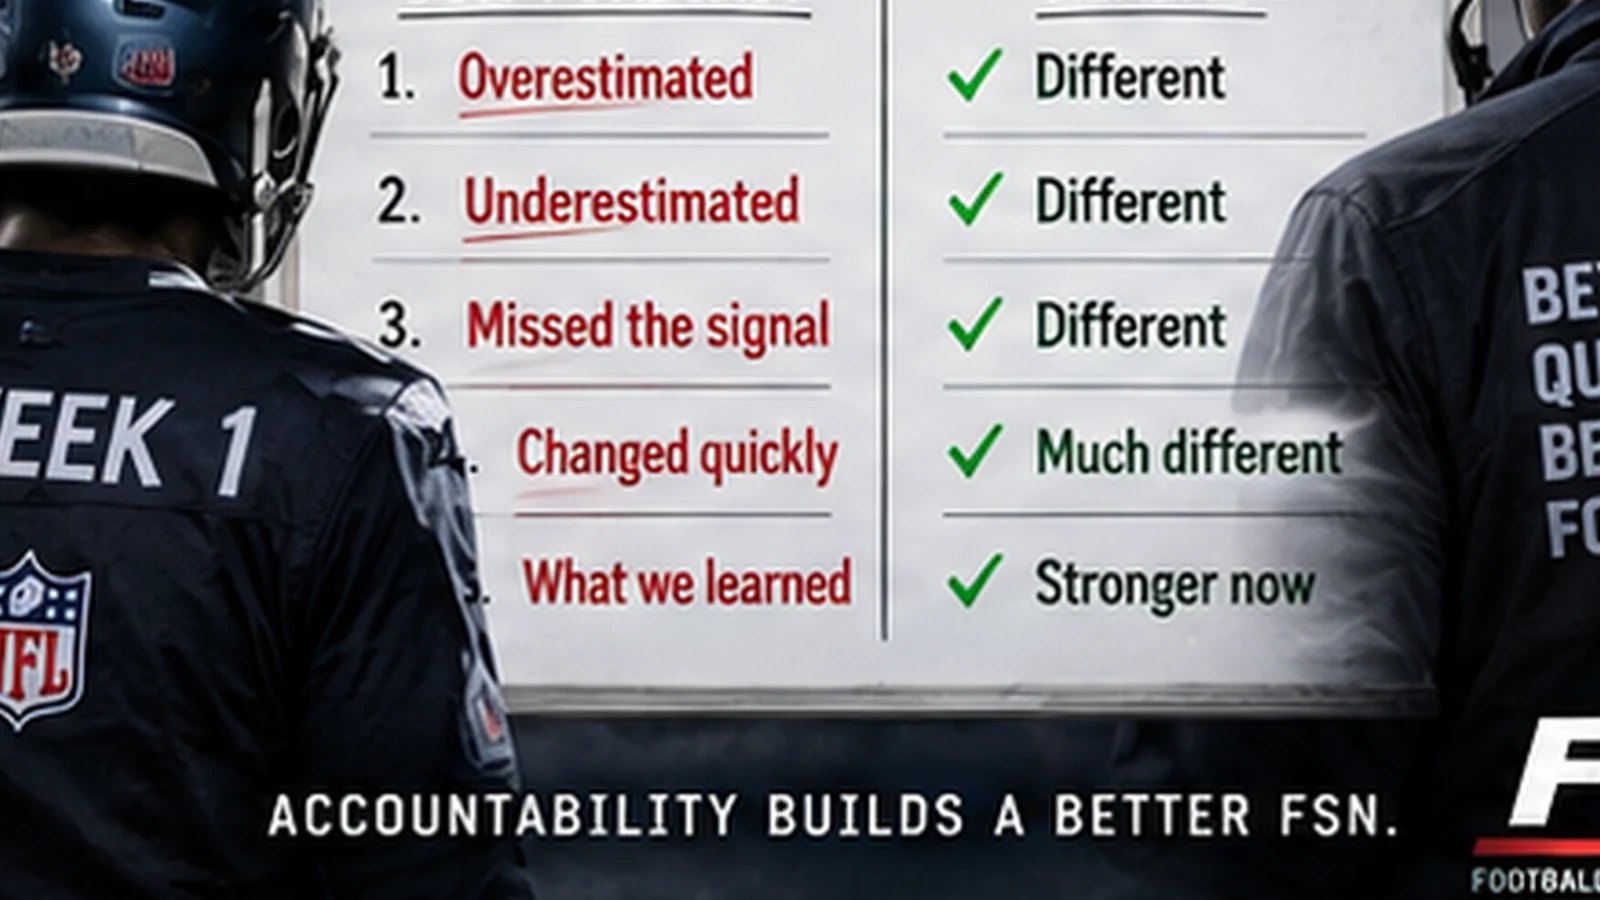
This is an FSN postmortem.
The point is not to celebrate the forecasts that aged well. It is to reopen the Week 1 file, compare it with the Week 3 checkpoint and document where the model was plainly too high, too low or too slow to react.
Because FSN preserves archived forecasts, the old numbers cannot be quietly replaced by better ones. That makes this less like a predictions article and more like reviewing game film after a bad Sunday.
Miss No. 1: the Chargers were given too much benefit of the doubt
Week 1 forecast: 47.2% playoff probability and 8.6 projected wins.
Week 3 checkpoint: 1.8% playoff probability and 4.6 projected wins.
That is a 45.4-point collapse in postseason probability.
The opening model treated Los Angeles like a fringe playoff team. Two games of current-season evidence have forced a much harsher view. This is the largest correction in the sample and the clearest sign that the preseason prior was too optimistic.
What FSN should learn: when early current-season evidence is strongly negative, the model has to decide how quickly it is willing to let go of the prior. The Chargers are the test case for whether that transition is happening fast enough.
Miss No. 2: Kansas City was priced far too cautiously
Week 1 forecast: 50.7% playoff probability, 8.8 projected wins and 5.1% to earn the AFC’s No. 1 seed.
Week 3 checkpoint: 92.3% playoff probability, 11.2 projected wins and 18.5% for the No. 1 seed.
The playoff swing is plus 41.6 points.
FSN was not wrong to leave uncertainty around Kansas City. It was wrong about the magnitude. The opening distribution gave too much weight to mediocre outcomes for a team that the first two weeks have pushed firmly into the AFC’s top tier.
What FSN should learn: uncertainty should widen a forecast, not flatten obvious high-end strength so aggressively that an elite team begins the year near a coin flip to make the playoffs.
Miss No. 3: Minnesota’s path was undervalued
Week 1 forecast: 36.3% to make the playoffs and 8.4 projected wins.
Week 3 checkpoint: 73.2% to make the playoffs and 10.4 projected wins.
That is a 36.9-point jump.
The biggest change is not a mysterious hidden metric. It is the value of two actual wins. Once they are locked, every simulated season begins from a stronger position.
What FSN should learn: the model should remain cautious about overreacting to two games, but it also cannot understate how much early wins alter the path in a 17-game season.
Miss No. 4: Cincinnati’s results outran the power profile
Week 1 forecast: 42.5% playoff probability and 8.5 projected wins.
Week 3 checkpoint: 76.3% playoff probability and 10.4 projected wins.
The Bengals gained 33.8 points of postseason probability even though FSN’s separate power model remains more restrained on their underlying strength.
This is an important distinction. The original forecast underestimated Cincinnati’s season path more than it underestimated Cincinnati’s raw team strength.
What FSN should learn: actual wins can change playoff probability faster than power ratings. The two systems should not be forced to move at the same speed.
Miss No. 5: San Francisco’s ceiling was still too low
Week 1 forecast: 64.1% playoff probability.
Week 3 checkpoint: 94.4% playoff probability, 12.4 projected wins and 35.5% to earn the NFC’s No. 1 seed.
The playoff swing is plus 30.3 points.
The Week 1 model already liked San Francisco. The miss was not direction; it was confidence. FSN left too much probability on average outcomes relative to what the first two weeks now support.
What FSN should learn: getting the direction right is not the same as getting the distribution right.
The Rams are the uncomfortable counterexample
FSN opened the season with the Rams as its Super Bowl favorite at 15.3%. Their Week 1 playoff probability was 80.7%, with 10.9 projected wins.
By Week 3, the Rams are at 53.1% to make the playoffs, 9.6 projected wins and only 3.2% to win the Super Bowl.
The playoff probability fell 27.6 points. The championship probability dropped by more than 12 points.
What FSN should learn: a strong prior can be useful, but a preseason championship case has to be vulnerable to real evidence quickly. Otherwise the model becomes stubborn instead of stable.
Seattle is not a miss in the same way
Seattle opened at 76.2% to make the playoffs and 14.9% to win the Super Bowl. By Week 3, those numbers are 93.3% and 26.4%.
FSN was already bullish. The model simply underestimated the degree of strength the first two weeks would reveal.
That matters because not every forecast revision should be labeled a failure. A model can be directionally right and still need a confidence adjustment.
What the tape says about the model
The Week 1 checkpoint had zero actual regular-season results locked. The Week 3 checkpoint has 32. FSN’s current-season evidence scale has risen to 73%.
Large September movement is therefore expected. The accountability question is not whether the numbers changed. It is whether they changed in sensible directions and whether the size of the original misses points to a calibration problem.
The Chargers and Chiefs are the clearest cases to keep studying because the original distributions were on the wrong side of the current evidence by more than 40 percentage points.
The reason to publish the misses
If FSN only surfaces the predictions that aged well, the archive becomes marketing. If the site shows the Chargers at 47.2% in Week 1 next to 1.8% in Week 3, and Kansas City at 50.7% next to 92.3%, the archive becomes a tool for understanding how the model learns.
That is more valuable than pretending the model knew the future.
FSN takeaway: the opening forecast was far too optimistic on the Chargers and Rams and far too cautious on Kansas City, Minnesota, Cincinnati and San Francisco. The next test is whether the model’s uncertainty narrows more intelligently as the sample grows.
Sources
FSN Week 1 Playoff Predictions archive: https://footballsportsnews.com/nfl/playoff-predictions/week-1-2026/
FSN Week 3 Playoff Predictions: https://footballsportsnews.com/nfl/playoff-predictions/week-3-2026/